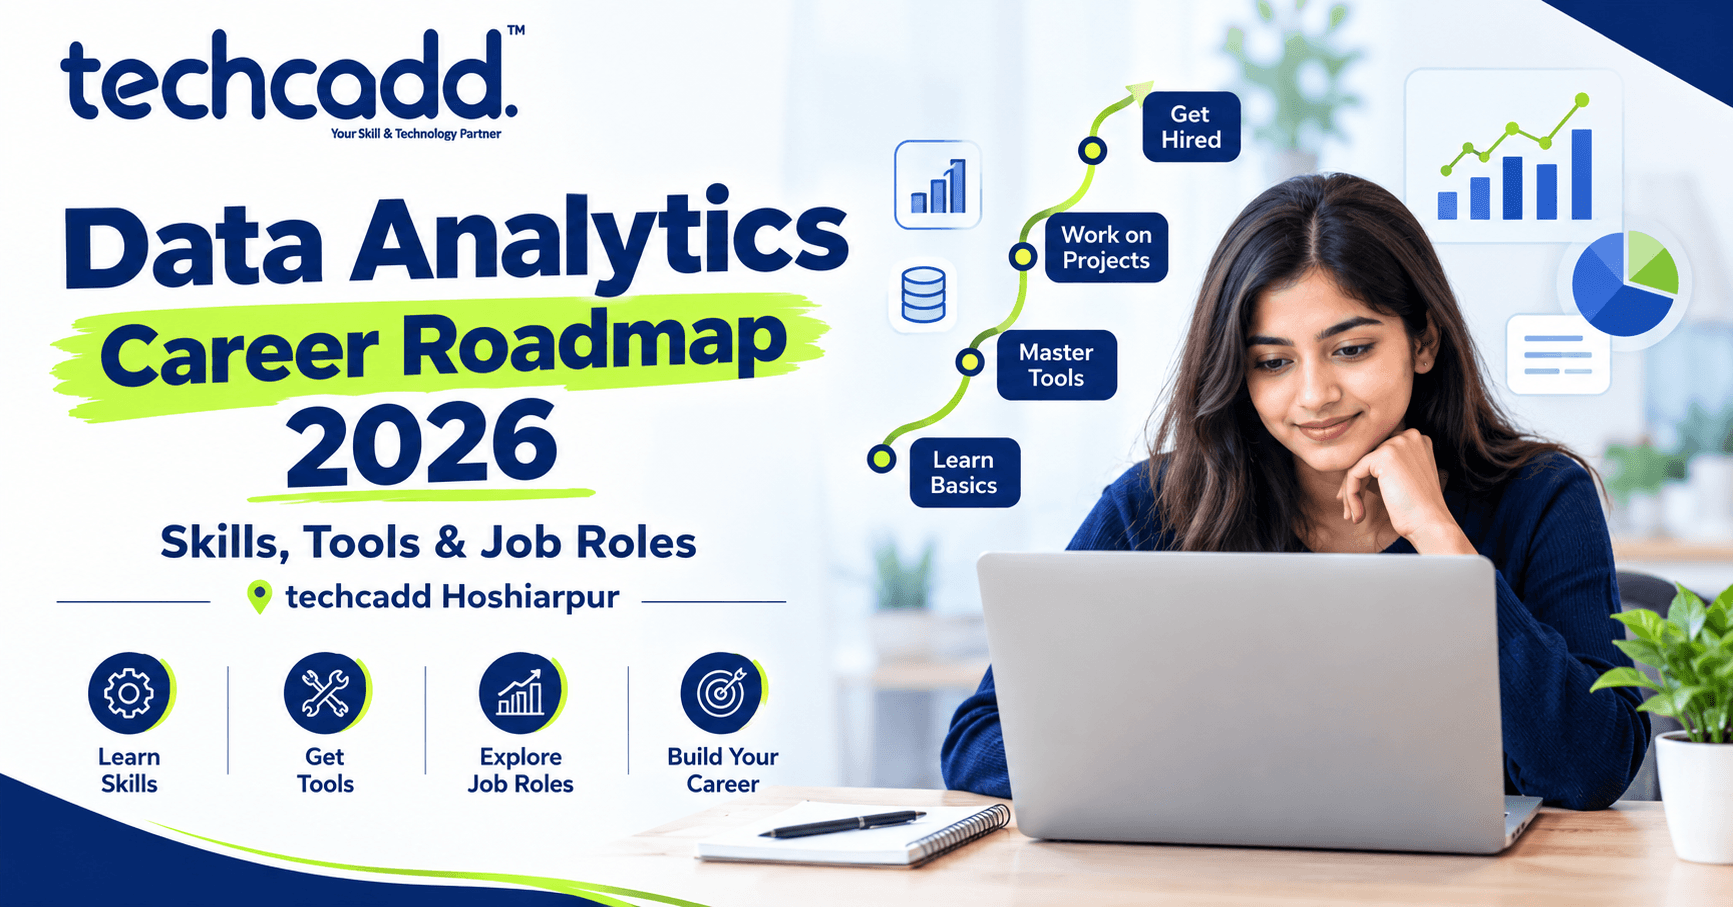
Data Analytics Career Roadmap 2026: Skills, Tools & Job Roles
So you've decided you want to build a career in data analytics. Maybe you saw someone post about their new job on LinkedIn, or maybe a cousin told you "data hi future hai." Either way, you're here, and you're probably wondering where to even start. That confusion is normal. Almost every student who walks into techcadd with this goal asks the same thing: "Sir, data analytics seekhna hai, but pata nahi shuru kahan se karein."
Let's fix that today.
Before jumping into tools and job titles, it helps to understand what a data analyst actually does on a daily basis, because a lot of students chase the term "data analytics" without really knowing what the work looks like. In simple words, a data analyst takes raw, messy information — sales numbers, customer feedback, website traffic, survey responses, anything — and turns it into something a business can actually use. You're not just staring at spreadsheets for fun. You're answering real questions like: Why did sales drop in July? Which product should we stop making? Which age group is buying the most from our app?
If you enjoy solving puzzles, noticing patterns, and explaining things in a way people understand, you'll probably enjoy this field a lot more than you expect.
Do You Need a Coding or Maths Background to Start?
This is probably the most common doubt among beginners. No, you don't need to be a computer science graduate or a maths topper to get into data analytics. Yes, having basic logical thinking helps, but the field is genuinely open to commerce students, arts students, engineering dropouts, working professionals switching careers — pretty much anyone willing to put in consistent effort.
What actually matters more than your background is your comfort with numbers and your willingness to sit with a problem until it makes sense. The technical part — Excel formulas, SQL queries, Python scripts — all of that is learnable. Students in Hoshiarpur from completely non-technical backgrounds have picked this up within a few months of focused practice.
The 2026 Roadmap: Where to Actually Begin
Let's break this down step by step, the way we'd explain it in an actual classroom, not a random YouTube video that throws twenty tools at you in the first five minutes and leaves you overwhelmed.
Step 1: Get Comfortable With Excel First
Everyone wants to jump straight to Python or fancy dashboards, but skipping Excel is one of the biggest mistakes beginners make. Excel teaches you how data actually behaves — rows, columns, filters, pivot tables, VLOOKUP, basic formulas. It's also still used heavily in real companies, especially smaller and mid-sized businesses, which make up a huge chunk of the hiring market. If you can't clean and organize data in Excel, jumping to advanced tools will only confuse you more, not less.
Give this stage genuine time. Don't rush past it just because it feels "too basic." A strong Excel foundation will make everything after this noticeably easier.
Step 2: Learn SQL — This Is Non-Negotiable
If there's one skill that almost every data analytics job posting mentions, it's SQL (Structured Query Language). This is how you talk to databases — asking them questions like "show me all customers who bought this product last month" or "which region generated the highest revenue this year."
A lot of students feel intimidated by SQL initially because it looks like coding, but honestly, it's one of the more logical and beginner-friendly languages out there. Once you understand SELECT, WHERE, GROUP BY, and JOIN statements, you'll realize it's less about memorizing syntax and more about thinking clearly about what question you're trying to answer.
Step 3: Pick Up Python (Yes, Even If You've Never Coded)
This is the step that scares most beginners, and honestly, it doesn't need to. You don't need to become a software developer. You just need enough Python to work with libraries like Pandas (for handling data) and Matplotlib or Seaborn (for basic visualizations).
Think of Python as your tool for automating boring, repetitive tasks that would otherwise eat up hours in Excel. Once students realize Python isn't about "writing complicated code" but about "telling the computer what to do step by step," the fear usually disappears within the first few weeks.
Step 4: Understand Data Visualization Tools
Numbers alone don't convince anyone. A CEO isn't going to scroll through 10,000 rows of data — they want a clean chart that tells a story in ten seconds. This is where tools like Power BI and Tableau come in.
Power BI, in particular, has become extremely popular for 2026 hiring, largely because it integrates smoothly with Excel and is widely used across industries — from retail to healthcare to logistics. Learning how to build interactive dashboards that highlight trends, comparisons, and outliers is a skill that instantly makes your resume stand out.
We'll go deeper into specific tools, real job roles, and salary expectations in the next part — including which certifications actually matter and which ones are just resume decoration.
Alright, picking up from where we left off. You now know that Excel, SQL, Python, and visualization tools like Power BI form the backbone of a data analyst's toolkit. But knowing the tools is only half the story — the other half is understanding what to actually do with them, and which ones deserve your serious attention in 2026.
Step 5: Statistics — The Part Everyone Skips (And Regrets Later)
Here's something most beginner guides won't tell you honestly: you cannot become a genuinely good data analyst without understanding basic statistics. Not the scary, formula-heavy kind you dreaded in school — just practical concepts like mean, median, standard deviation, correlation, and probability.
Why does this matter? Because tools can generate charts for you, but they can't tell you whether a pattern is actually meaningful or just random noise. If you don't understand statistics even a little, you'll end up presenting misleading conclusions without realizing it — and in a real job, that's the kind of mistake that gets noticed fast. Spend a few weeks genuinely understanding these basics. You don't need to master a full statistics degree, just enough to think critically about the numbers in front of you.
Step 6: Learn How to Tell a Story With Data
This one surprises a lot of students. Being technically skilled isn't enough if you can't communicate your findings. A huge part of an analyst's job is presenting insights to people who aren't technical — marketing managers, founders, HR heads — and making sure they actually understand what the data is saying.
This is a soft skill, but it's one that separates analysts who get promoted quickly from those who stay stuck at the same level for years. Practice explaining your findings out loud, as if you're talking to someone with zero technical background. If you can make a non-technical person go "oh, that makes sense," you're doing it right.
Which Tools Actually Matter in 2026?
The tools landscape shifts a bit every year, so let's be specific about what's genuinely worth your time right now, rather than a random list copied from three years ago.
Excel/Google Sheets — still the entry point for most real-world data tasks, especially in small and mid-sized companies.
SQL — non-negotiable, used across nearly every analytics role regardless of industry.
Python (with Pandas, NumPy) — increasingly expected even for entry-level roles, not just advanced ones.
Power BI — one of the fastest-growing tools in India's job market, largely due to its affordability and integration with Microsoft products businesses already use.
Tableau — still relevant, especially in larger companies and MNCs, though Power BI has been closing the gap.
Basic understanding of AI-assisted analytics tools — 2026 is seeing more companies integrate AI copilots into their BI tools, so familiarity with how these work (not necessarily mastery) gives you an edge.
Notice something? You don't need to learn everything at once, and you definitely don't need every certification under the sun. Depth in a few tools beats a shallow understanding of ten.
"Sir, Which Certifications Should I Actually Get?"
This question comes up constantly, and the honest answer is: certifications help you learn structured content and look decent on a resume, but they are not magic tickets to a job. Recruiters care more about what you can actually do — can you clean a messy dataset, write a working SQL query, build a dashboard that makes sense — than which certificate logo is on your LinkedIn.
That said, if you want structured certifications to guide your learning, options like Google Data Analytics Certificate, Microsoft Power BI certifications, or SQL-specific courses are reasonably respected. Use them as a learning structure, not a substitute for actual practice.
Building a Portfolio That Actually Gets Noticed
Here's something most students underestimate — a portfolio matters more than a stack of certificates. Hiring managers want proof, not promises. Even two or three solid projects, where you've taken a real (or realistic) dataset and shown your full process — cleaning the data, analyzing it, visualizing it, and explaining your findings — will do more for you than five random certificates.
Pick topics you genuinely find interesting. Analyze cricket match statistics, local business sales trends, social media engagement patterns, or even public government datasets. The topic matters less than showing a clear, logical thought process from raw data to final insight.
At techcadd in Hoshiarpur, we've seen students go from "I don't even know what a pivot table is" to confidently presenting dashboards within a matter of months — and the difference almost always comes down to consistent practice on real projects, not just passively watching tutorials.
In the next part, we'll talk about actual job roles you can
target, realistic salary expectations for 2026, and the common mistakes beginners make that slow down their progress unnecessarily.
Let's talk about the part everyone's actually curious about — what jobs can you actually get, what do they pay, and how do you avoid wasting months on the wrong approach.
Job Roles You Can Target in 2026
Data analytics isn't just one single job title. As you grow, different roles open up depending on your interest and strengths. Here's a realistic breakdown:
Data Analyst (Entry-Level)
This is usually where most beginners land first. You'll be working with Excel, SQL, and basic dashboards, helping teams understand sales trends, customer behavior, or operational performance. It's a great starting point because it exposes you to real business problems without requiring advanced technical depth.
Business Analyst
A slightly different flavor of the same skillset, but with more focus on understanding business processes and translating data insights into business decisions. If you enjoy talking to different departments and understanding how a company actually runs, this path suits you well.
BI (Business Intelligence) Developer
Once you're comfortable with tools like Power BI or Tableau, this role focuses heavily on building and maintaining dashboards that leadership teams rely on daily. It's a natural next step for analysts who enjoy the visualization side of things.
Data Analyst → Senior Analyst → Analytics Manager
This is the typical growth path. With 2-3 years of solid experience, you move into roles with more ownership — leading small projects, mentoring juniors, and working more closely with strategic decisions rather than just reporting numbers.
Marketing/Product Analyst
For those interested in a more specialized direction, many companies hire analysts specifically for marketing campaigns or product performance, where you dig into user behavior, conversion rates, and campaign effectiveness.
What About Salary Expectations?
This varies quite a bit based on city, company size, and your actual skill level, so treat any number as a rough starting reference rather than a guarantee. Entry-level data analyst roles in India generally start modestly and grow steadily with experience and demonstrated skills — the jump from fresher to 2-3 years experienced is usually where you see the most noticeable growth. Rather than fixating on a specific number, focus on becoming genuinely skilled — the pay tends to follow competence, especially in a field that's still actively growing.
Common Mistakes Beginners Make (Learn From Others' Slip-Ups)
Jumping straight to Python without Excel/SQL basics — this often creates gaps in fundamental understanding that show up later.
Collecting certificates instead of building projects — recruiters want proof of skill, not just paper.
Ignoring communication skills — being technically strong but unable to explain findings clearly holds people back more than they realize.
Trying to learn everything at once — spreading yourself across ten tools superficially is far weaker than mastering three or four properly.
Not practicing on real or realistic datasets — theory without application doesn't build real confidence or job-readiness.
Is Data Analytics Still Worth It in 2026?
Short answer — yes, and for good reason. As more businesses, even smaller local ones in cities like Hoshiarpur, move toward digital operations, the need for people who can make sense of data isn't slowing down. What's changing is the bar for entry — companies now expect practical skills and project experience over just theoretical knowledge. That's actually good news for someone willing to put in genuine, structured effort rather than looking for shortcuts.
If you're serious about this path, the sequence is simple: start with Excel, move to SQL, add Python, learn a visualization tool, build real projects, and keep practicing your ability to explain findings clearly. Do this consistently, and the job opportunities will follow.
At techcadd, we've guided students through exactly this journey — many starting with zero technical background and walking out with the skills and confidence to take on real analytics roles.


Comments
Nothing here yet. Be the first to say something.