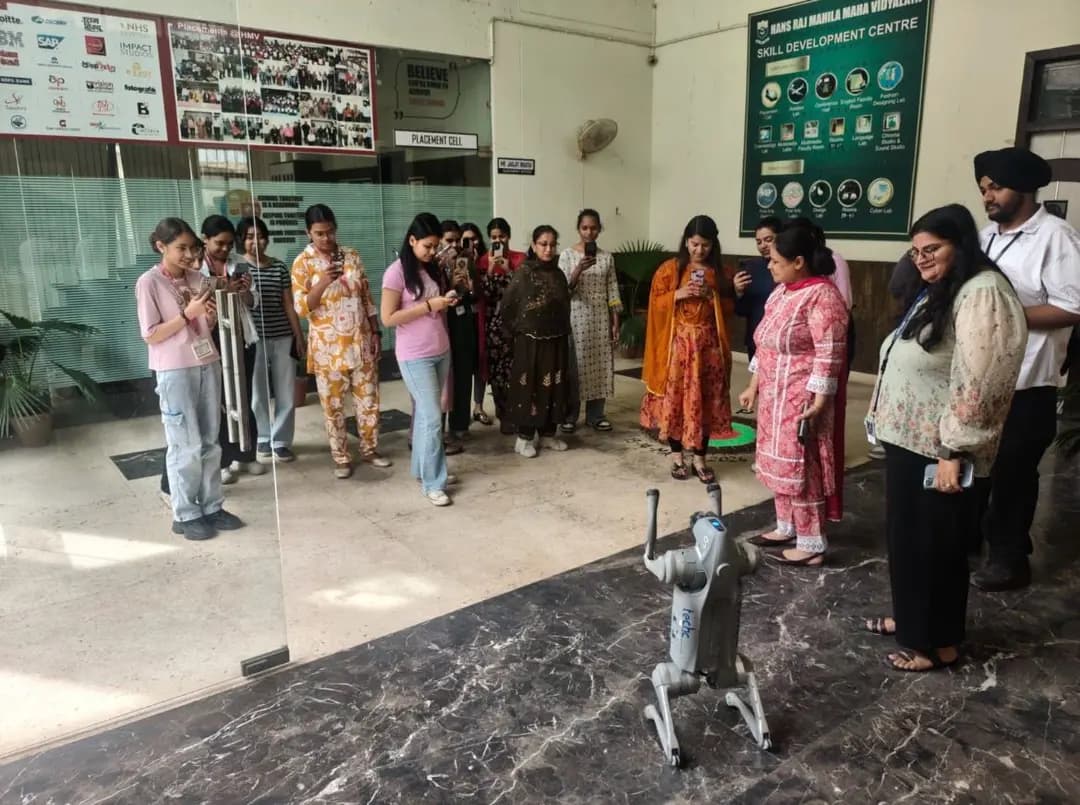
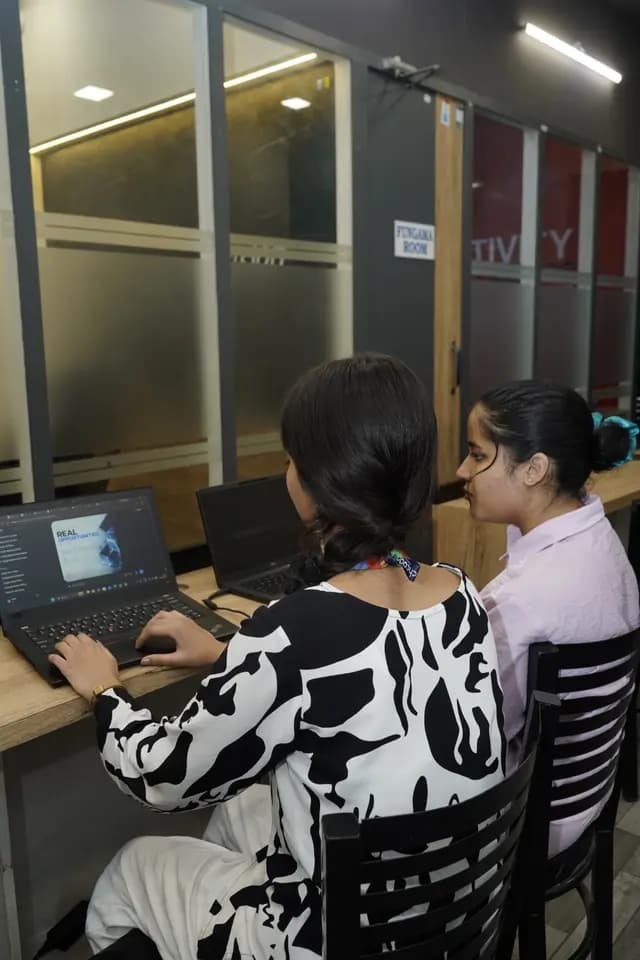
seminarin-person
Turning Data into Interactive Visual Stories with Tableau
Learn how to transform raw data into compelling, interactive dashboards and visual stories using Tableau.
- Date
- Thursday, 22 October 2026
- Venue
- Hoshiarpur
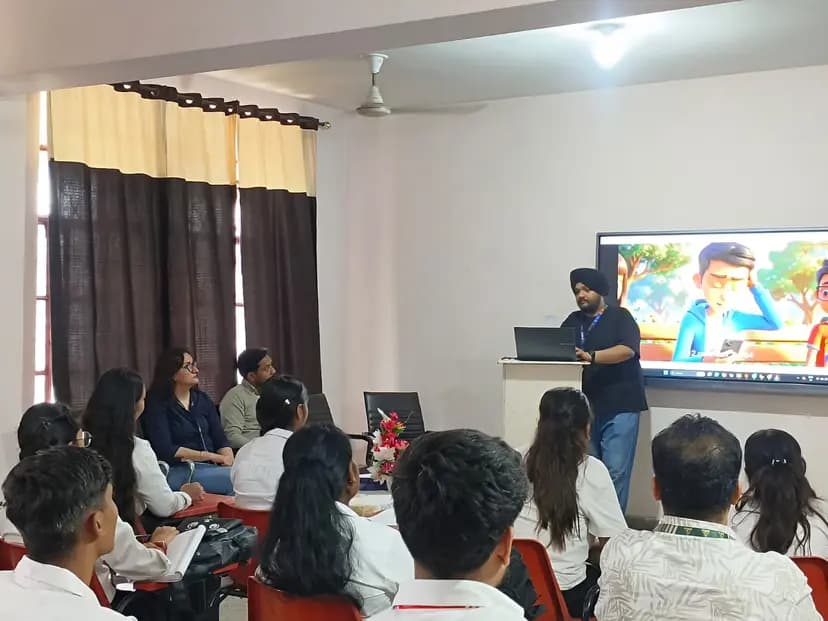
Data storytelling is an essential skill for modern professionals looking to communicate insights effectively. In this hands-on workshop, participants will dive into Tableau fundamentals, learning how to connect data sources, build dynamic visualizations, and design interactive dashboards that drive decision-making.
Whether you are a beginner or looking to sharpen your analytics presentation skills, this session covers practical techniques for turning complex datasets into clear, engaging visual narratives.
Photographs